When dealing with data, understanding how it is distributed is crucial. One important concept in statistics is a skewed right distribution. This type of data distribution can be found in various fields, including economics, business, healthcare, and real estate. In this article, we will explore the meaning of skewed right, its causes, real-world examples, and how it impacts decision-making.


What Does Skewed Right Mean?
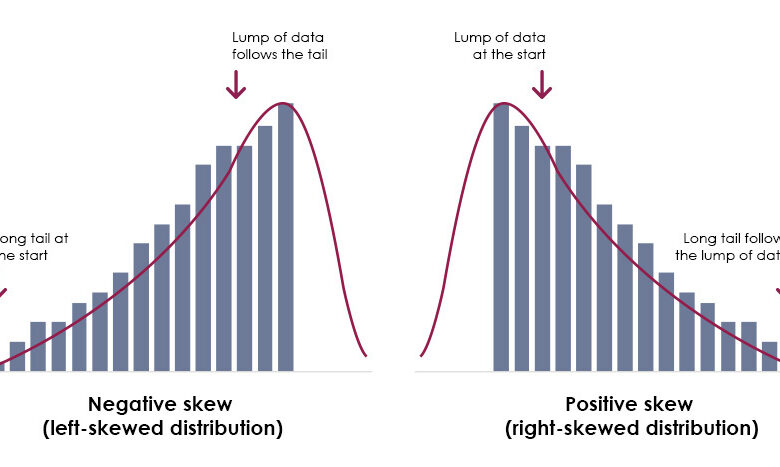
A skewed right distribution, also known as positively skewed, occurs when most of the data points cluster on the left side, with a long tail extending toward the right. This means that a few extreme values (outliers) pull the mean to the right.
Key Characteristics of a Skewed Right Distribution
- The mean is greater than the median.
- The tail of the distribution extends to the right.
- There are a few high-value outliers.
- The majority of data points are concentrated on the lower end.
Visual Representation
Imagine a histogram where most bars are on the left, but a few high values stretch the graph toward the right. This pattern is a clear sign of a skewed right distribution.
Causes of a Skewed Right Distribution
Several factors can lead to a skewed right distribution. Some of the most common causes include:
- Natural Limitations: Some data sets naturally have a lower boundary but no upper limit. For example, salaries can’t go below zero, but they can rise significantly.
- Income and Wealth Distribution: In many societies, a few individuals earn significantly more than the majority.
- Population Growth: In certain regions, birth rates might be high, but a few areas experience extreme growth, pushing the average upward.
- Errors in Data Collection: If a data set includes incorrect or extreme values, it can cause a right skew.
Examples of Skewed Right Distributions in Real Life
1. Income and Salary Data
One of the most common examples is income distribution. While most people earn an average wage, a few earn millions, creating a skewed right effect.
2. Property Prices
Real estate markets often show a skewed right pattern, with most homes priced at average levels but a few luxury properties pulling the average price higher.
3. Hospital Stay Durations
Most patients recover within a short period, but some require extended stays due to complications, making hospital stay durations skewed right.
4. Social Media Followers
Many social media users have a moderate following, but influencers and celebrities have millions of followers, causing a right skew.
5. Stock Market Returns
In stock markets, most companies have moderate returns, but a few experience massive gains, making the distribution skewed right.
Impact of a Skewed Right Distribution
Understanding whether data is skewed right is essential because it affects analysis and decision-making. Here are some important impacts:
1. Misleading Averages
Since the mean is pulled by outliers, it may not accurately represent the majority of data points.
2. Business and Economic Decisions
Companies analyzing salary data or consumer spending must be cautious of skewed right distributions to avoid incorrect pricing or wage policies.
3. Healthcare and Policy Making
In healthcare, understanding skewed right distributions in hospital stays can help in resource allocation and planning.
4. Investment Strategies
Investors should recognize that stock market returns are often skewed right, meaning a few companies drive market gains.
How to Handle a Skewed Right Distribution
If data is skewed right, analysts may need to adjust their approach. Here are some techniques to manage and interpret such distributions:
1. Use the Median Instead of the Mean
Since the mean is affected by outliers, the median provides a better measure of central tendency.
2. Log Transformation
Applying a logarithmic transformation can help normalize a skewed right distribution.
3. Remove Outliers
In some cases, removing extreme values can help provide a clearer picture of the data.
4. Apply Weighted Averages
Weighting data can help balance out the effects of outliers in financial and economic analysis.
Table: Comparison of Different Distributions
| Distribution Type | Mean vs. Median | Shape of Tail | Common Examples |
| Symmetric (Normal) | Mean = Median | No tail | Heights, IQ scores |
| Skewed Left | Mean < Median | Left tail | Test scores, age at retirement |
| Skewed Right | Mean > Median | Right tail | Incomes, property prices |
Conclusion
Understanding a skewed right distribution is crucial for data analysis and decision-making. Whether you’re examining salary data, stock market trends, or healthcare statistics, recognizing and adjusting for skewed data ensures accurate insights. By using the right tools and techniques, businesses, economists, and researchers can make well-informed choices.
If you want to stay updated on similar insightful topics, visit trendnewsuk.co.uk for the latest articles on data trends, business insights, and economic analysis.